
January 26, 2025, 11:18 am ET, BY Thomas H. Kee Jr- Editor, Stock Traders Daily| Editor: Thomas H. Kee Jr. (Follow on LinkedIn)
Longer Term Trading Plans for IGF
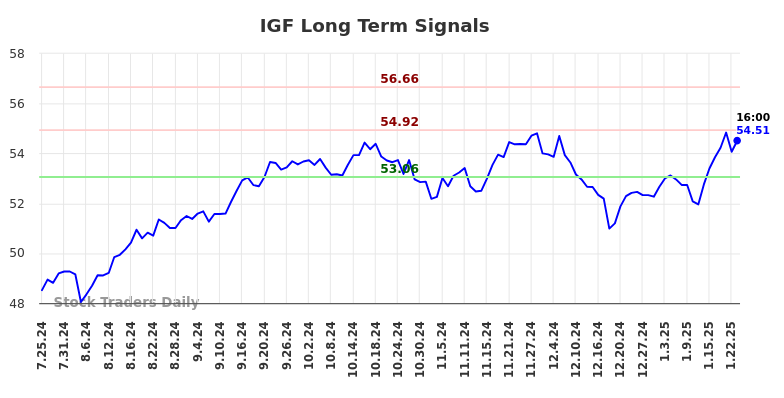
- Buy IGF near 53.06 target 54.92 stop loss @ 52.91
- Short IGF slightly under 54.92, target 53.06, stop loss @ 55.08
Swing Trading Plans for IGF
- Buy IGF slightly over 54.92, target 55.4, Stop Loss @ 54.76
- Short IGF slightly near 54.92, target 54.37, Stop Loss @ 55.08.
Day Trading Plans for IGF
- Buy IGF slightly over 54.67, target 54.92, Stop Loss @ 54.54
- Short IGF slightly near 54.67, target 54.37, Stop Loss @ 54.8.
The technical summary data tells us to buy IGF near 53.06 with an upside target of 54.92. This data also tells us to set a stop loss @ 52.91 to protect against excessive loss in case the stock begins to move against the trade. 53.06 is the first level of support below 54.51 , and by rule, any test of support is a buy signal. In this case, support 53.06 would be being tested, so a buy signal would exist.
The technical summary data is suggesting a short of IGF as it gets near 54.92 with a downside target of 53.06. We should have a stop loss in place at 55.08though. 54.92 is the first level of resistance above 54.51, and by rule, any test of resistance is a short signal. In this case, if resistance 54.92 is being tested, so a short signal would exist.
If 54.92 begins to break higher, the technical summary data tells us to buy IGF just slightly over 54.92, with an upside target of 55.4. The data also tells us to set a stop loss @ 54.76 in case the stock turns against the trade. 54.92 is the first level of resistance above 54.51, and by rule, any break above resistance is a buy signal. In this case, 54.92, initial resistance, would be breaking higher, so a buy signal would exist. Because this plan is based on a break of resistance, it is referred to as a Long Resistance Plan.
The technical summary data is suggesting a short of IGF if it tests 54.92 with a downside target of 54.37. We should have a stop loss in place at 55.08 though in case the stock begins to move against the trade. By rule, any test of resistance is a short signal. In this case, if resistance, 54.92, is being tested a short signal would exist. Because this plan is a short plan based on a test of resistance it is referred to as a Short Resistance Plan.
If 54.67 begins to break higher, the technical summary data tells us to buy IGF just slightly over 54.67, with an upside target of 54.92. The data also tells us to set a stop loss @ 54.54 in case the stock turns against the trade. 54.67 is the first level of resistance above 54.51, and by rule, any break above resistance is a buy signal. In this case, 54.67, initial resistance, would be breaking higher, so a buy signal would exist. Because this plan is based on a break of resistance, it is referred to as a Long Resistance Plan.
The technical summary data is suggesting a short of IGF if it tests 54.67 with a downside target of 54.37. We should have a stop loss in place at 54.8 though in case the stock begins to move against the trade. By rule, any test of resistance is a short signal. In this case, if resistance, 54.67, is being tested a short signal would exist. Because this plan is a short plan based on a test of resistance it is referred to as a Short Resistance Plan.
Check the time stamp on this data. Updated AI-Generated Signals for Ishares Global Infrastructure Etf (IGF) available here: IGF.
IGF Ratings for January 26:
Blue = Current Price
Red= Resistance
Green = Support
Click the Get Real Time Updates button below.
In the login prompt, select forgot username
Type the email you use for Factset
Use the user/pass you receive to login
You will have 24/7 access to real time updates.
From then on you can just click to get the real time update whenever you want.
GET REAL TIME UPDATES
Evitar Corte warned of market crash risk four times since 2000.
It identified the Internet Debacle before it happened.
It identified the Credit Crisis before it happened.
It identified the Corona Crash too.
See what Evitar Corte is Saying Now.
Get Notified When our Ratings Change:Take a Trial
This report was produced using AI developed by Stock Traders Daily. Over the past 20 years this proprietary AI has been refined to help identify the most opportune trading strategies for both individual stocks and the stock markets themselves. This methodology is also applied to Index options, ETFs, and futures. The objective of this specific report is to optimize trading in Ishares Global Infrastructure Etf (NYSE: IGF) while incorporating prudent risk controls.
Fundamental Charts for IGF:
GET MORE AI-GENERATED SIGNALS:
Type a few symbols and Take a Trial. The signals for these will appear immediately on your My Stocks Page; add more too.![]()
© 2022-2024 – All Rights Reserved
More Stories
Zombie IXPs: The Four Types of Exchanges That Refuse to Die, but Fail to Live
The Shift in Peering Threatening the Internet’s Foundations
Remembering Alan Barrett: A Builder of the African Internet